
Construction Bid Win Rate Explained for Contractors in 2026
Construction bid win rate is defined as the percentage of bids a contractor wins out of the total number of bids submitted. It is the single most direct measure of bidding efficiency and market fit in the construction industry. Most contractors track this as a simple count, but the metric carries far more diagnostic power when paired with dollar-weighted analysis and trade-specific benchmarks. This article breaks down what win rates mean, how they vary by bid type and trade, and what construction professionals can do right now to improve their numbers across both federal and private contracts.
What are typical construction bid win rates by bid type and trade?
Win rates in construction are not one-size-fits-all. They shift significantly based on how a bid is structured and what trade is performing the work.
The clearest dividing line is bid type. Hard-bid public work averages 10–20%, while negotiated bids land between 30–50%, and relationship-driven work regularly exceeds 50%. That gap exists because hard bids are fully open to competition, while negotiated and relationship-driven opportunities filter the field before the numbers are ever submitted. Bid-to-win ratios follow the same pattern: hard bids run roughly 5:1 to 10:1, while negotiated bids compress to 2:1 to 3:1.

Top-performing general contractors who pursue selective opportunities hit 25–35% win rates. Teams with low selectivity fall below 15%. The difference is not luck. It is the quality of the go/no-go process applied before a single estimate is built.
Trade-specific benchmarks add another layer of context. The table below shows typical win rate ranges by specialty:
| Trade | Typical Win Rate Range |
|---|---|
| Erosion control | 25–45% |
| Concrete | 22–38% |
| Electrical | 18–30% |
| General contracting (hard bid) | 10–20% |
| Negotiated / relationship-driven | 30–50%+ |
A few key points on reading these ranges:
- Rates above the upper range may signal underpriced overhead, not superior performance. Abnormally high win rates can indicate a contractor is leaving profit on the table.
- Rates below the lower range point to proposal quality issues, poor market fit, or misaligned scope.
- Federal vs. private averages differ meaningfully. Federal proposal-stage win rates (called Pwin, or probability of winning) run about 15–30% for federal work, while state and local government contracts average 30–45%.
Understanding where your numbers fall within these ranges is the first step toward a real improvement plan.
How to accurately calculate and interpret your bid win rate
The basic formula for bid win rate is straightforward: divide the number of jobs won by the total number of bids submitted, then multiply by 100. If your firm wins 12 of 50 bids, your bid hit ratio is 24%. That number tells you how often you win. It does not tell you how much you win.
That is where dollar-weighted win rate becomes critical. Divide the total contract value of jobs won by the total value of all bids submitted. A firm winning 24% of bids by count but only 10% by dollar value is consistently winning smaller jobs. That pattern signals a selection problem, not a pricing problem.
Here is a numbered process for tracking both metrics accurately:
- Log every bid submitted, including the estimated contract value and the outcome (win, loss, no-award).
- Calculate count-based win rate monthly: wins ÷ total bids × 100.
- Calculate dollar-weighted win rate monthly: total value won ÷ total value bid × 100.
- Compare the two numbers. A large gap between them reveals whether you are winning the right jobs.
- Segment by bid type. Separate hard bids, negotiated bids, and federal bids to see which category drives your results.
Common pitfalls in reading these numbers include ignoring bid size distribution and failing to account for bids that are still pending. Pending bids inflate your denominator and deflate your apparent win rate until they resolve.
Pro Tip: Track overhead rate monthly alongside your win rate. A rising win rate paired with shrinking margins is a warning sign that your overhead is underpriced, not that your bidding is improving.
What strategies improve construction bid win rates without simply increasing bid volume?
The most common mistake contractors make is treating win rate as a volume problem. Submitting more bids does not raise your win rate. It dilutes estimating resources and lowers proposal quality across the board. Selective bids see 40–60% win rates, while spreading effort over many weak opportunities drives rates down and burns out estimating teams.
The following tactics raise win rates by improving bid quality and selection discipline:
- Apply a go/no-go framework before every bid. Score each opportunity on client relationship, project fit, competition level, and margin potential. Walk away from bids that score below your threshold.
- Conduct win-loss debriefs after every outcome. Ask owners and GCs directly why you won or lost. The answers are more useful than any internal analysis.
- Reduce document review time. Estimating teams spend 38% of bid hours on document review. Top teams cut that below 20% by building standardized review checklists and scope gap trackers.
- Limit scope gaps. High-performing teams keep scope gaps below 2 per $10 million contract. Scope gaps are a leading cause of post-award disputes and a signal to owners that your proposal is not thorough.
- Use win-loss data to refine your target market. If your win rate in electrical work consistently outperforms your rate in general contracting, that data should drive your pursuit calendar.
Understanding why contractors underbid projects is also part of this picture. Underbidding to win volume is a profitability trap that a disciplined go/no-go process helps you avoid.
Pro Tip: Build a simple bid log in a spreadsheet or project management tool. Track bid date, contract value, bid type, and outcome. After 90 days, you will have enough data to identify which project types and clients produce your best win rates.
How do federal and private sector bid win rates differ?
Federal and private sector bidding operate under fundamentally different rules, and win rates reflect that gap directly.
Federal contracts use a pipeline probability model called Pwin. Each stage of the federal pursuit process carries a different probability of winning. A submitted proposal carries roughly a 25–45% chance of winning at the proposal stage, but that number shifts based on incumbency, past performance ratings, and set-aside certifications. An incumbent contractor with a strong past performance record on a recompete bid carries a meaningfully higher Pwin than a new entrant.
The table below compares key win rate factors across federal and private markets:
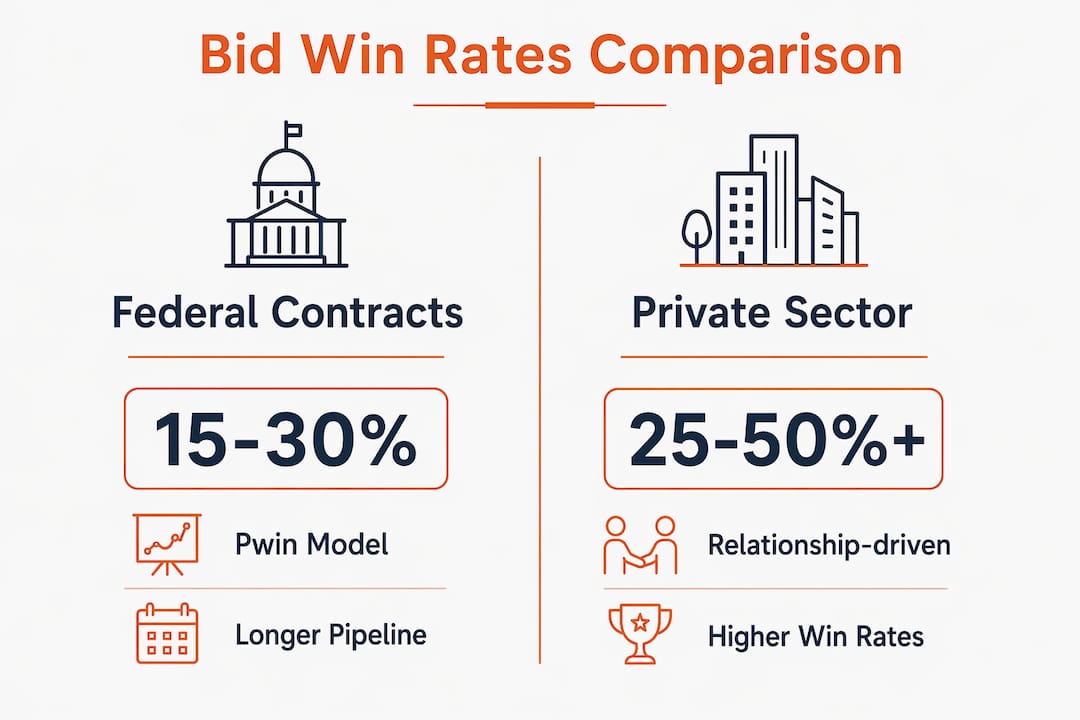
| Factor | Federal contracts | Private sector |
|---|---|---|
| Typical win rate range | 15–30% (Pwin) | 25–50%+ |
| Primary driver | Past performance, compliance, certifications | Relationships, price, speed |
| Incumbency advantage | High | Moderate |
| Set-aside impact | Significant (SDVOSB, 8(a), HUBZone) | Minimal |
| Pipeline forecasting tool | Pwin model | Relationship pipeline |
Private sector win rates trend higher because relationship-driven work dominates. A GC or specialty contractor with a strong client history can realistically target 40–50% win rates on repeat clients. Federal work is more structured, and past performance in federal bids carries formal weight in source selection evaluations.
For firms pursuing federal growth, a federal contract growth plan that maps pipeline stages to Pwin probabilities gives leadership a realistic revenue forecast rather than a wishful one. Certifications like 8(a), HUBZone, or SDVOSB status directly improve Pwin by reducing the competitive field through set-aside contracts. Firms that combine certification with strong past performance records consistently outperform uncertified competitors in federal win rate analysis.
Key takeaways
A disciplined go/no-go process, combined with both count-based and dollar-weighted win rate tracking, is the most direct path to higher bid success and stronger profitability in construction.
| Point | Details |
|---|---|
| Win rate formula | Divide jobs won by total bids submitted and multiply by 100 for your count-based rate. |
| Dollar-weighted tracking | Compare contract value won to total value bid to detect selection quality issues. |
| Bid type benchmarks | Hard bids average 10–20%; negotiated bids reach 30–50%; relationship-driven work exceeds 50%. |
| Go/no-go discipline | Selective bidding produces 40–60% win rates; low selectivity teams fall below 15%. |
| Federal vs. private | Federal Pwin runs 15–30%; private sector rates reach 25–50%+ with strong client relationships. |
What I have learned from watching contractors chase the wrong number
I have seen contractors celebrate a 30% win rate while quietly losing money on every project they win. The count-based win rate looked healthy. The dollar-weighted rate told a different story. They were consistently winning smaller, lower-margin jobs while losing the larger contracts that would have moved the needle on profitability.
The real problem was not their proposals. It was their pursuit list. They were bidding everything that came across their desk, which meant their estimating team was stretched thin and their proposals on high-value jobs were generic. When they finally applied a go/no-go scoring process and cut their bid volume by roughly a third, their win rate on the remaining bids climbed and their average contract value went up with it.
Federal contractors make a different version of the same mistake. They focus on Pwin percentages without building the past performance record that actually moves those numbers. A firm that wins a small federal contract and delivers it flawlessly has a stronger foundation for the next pursuit than a firm that submits polished proposals with no track record. The construction bidding process rewards preparation and history, not just presentation.
My consistent recommendation is to track both metrics every month, debrief every loss, and treat your bid log as a business intelligence tool. The data you collect over 12 months will tell you exactly where to focus your estimating resources for the best return.
— Rowena
How Federal-rconstructionsolutions supports your bid success
Federal-rconstructionsolutions works directly with construction firms that want to raise their win rates in both federal and private markets. The team specializes in RFP writing, compliance support, and pipeline forecasting that reflects real Pwin modeling, not guesswork.
Federal-rconstructionsolutions’ federal procurement services cover the full pursuit cycle, from opportunity qualification through proposal submission, with a track record of 90% compliance on bid submissions. For firms expanding into private sector work, the private sector construction services team brings the same proposal discipline to relationship-driven markets where quality and speed both matter. If your current win rate is not reflecting the quality of your work, the issue is almost always in the process, and that is exactly what Federal-rconstructionsolutions is built to fix.
FAQ
What is a good construction bid win rate?
A win rate of 25–35% is considered strong for general contractors pursuing selective opportunities. Hard-bid public work typically averages 10–20%, while negotiated and relationship-driven bids regularly exceed 30–50%.
How is construction bid win rate calculated?
Divide the number of jobs won by the total number of bids submitted, then multiply by 100. For example, 12 wins out of 50 bids equals a 24% win rate.
Why does my win rate look good but my revenue is flat?
Count-based win rate can mask selection problems. Track dollar-weighted win rate by dividing total contract value won by total value bid. A gap between the two numbers means you are winning smaller jobs than you are pursuing.
How do federal bid win rates differ from private sector rates?
Federal proposal-stage win rates average 15–30%, while private sector rates reach 25–50%+ depending on client relationships. Incumbency, past performance, and set-aside certifications are the primary drivers of federal Pwin.
What is the fastest way to improve bid win rate?
Apply a go/no-go scoring framework to every opportunity before committing estimating resources. Selective bidding consistently produces 40–60% win rates, compared to below 15% for teams that bid without qualification criteria.