
Wages Up in 2026: What the Numbers Mean for Your Pay
Yes, nominal wages are up. Over the 12 months ending June 2026, nominal average weekly wages rose 3.8% while headline CPI-U climbed around 3.5%., meaning paychecks technically outpaced inflation. But that 0.29 percentage point margin is thin, and the real picture is more complicated than the headline suggests.
Here are the numbers that matter most right now:
- Nominal average weekly earnings (YoY): +3.8% (June 2025–June 2026)
- CPI-U (YoY): +3.5% — with a monthly dip of 0.4% in June 2026
- Real average hourly earnings (YoY): +0.1% — essentially flat after adjusting for inflation
- Atlanta Fed Wage Growth Tracker (June 2026, 3-month avg): 3.6%, with job-changers at 4.1% and job-stayers at 3.4%
The verdict: wages are nominally up, but real purchasing power gains are small and volatile. Workers who changed jobs fared noticeably better than those who stayed put.
Key Takeaways
| Point | Details |
|---|---|
| Nominal wages outpaced CPI | Average weekly wages rose 3.8% YoY vs. CPI-U at 3.5% — a 0.29 percentage point margin. |
| Real gains are nearly flat | Real average hourly earnings rose only 0.1% over the 12-month window ending June 2026. |
| Job-changers gained the most | Atlanta Fed data show job-changers averaged 4.1% wage growth vs. 3.4% for job-stayers. |
| Use the right series | For individual wage experience, use the Atlanta Fed tracker; for payroll aggregates, use BLS CES data. |
| Track monthly with free tools | BLS Real Earnings, Atlanta Fed tracker, USAFacts, and FRED all update monthly at no cost. |
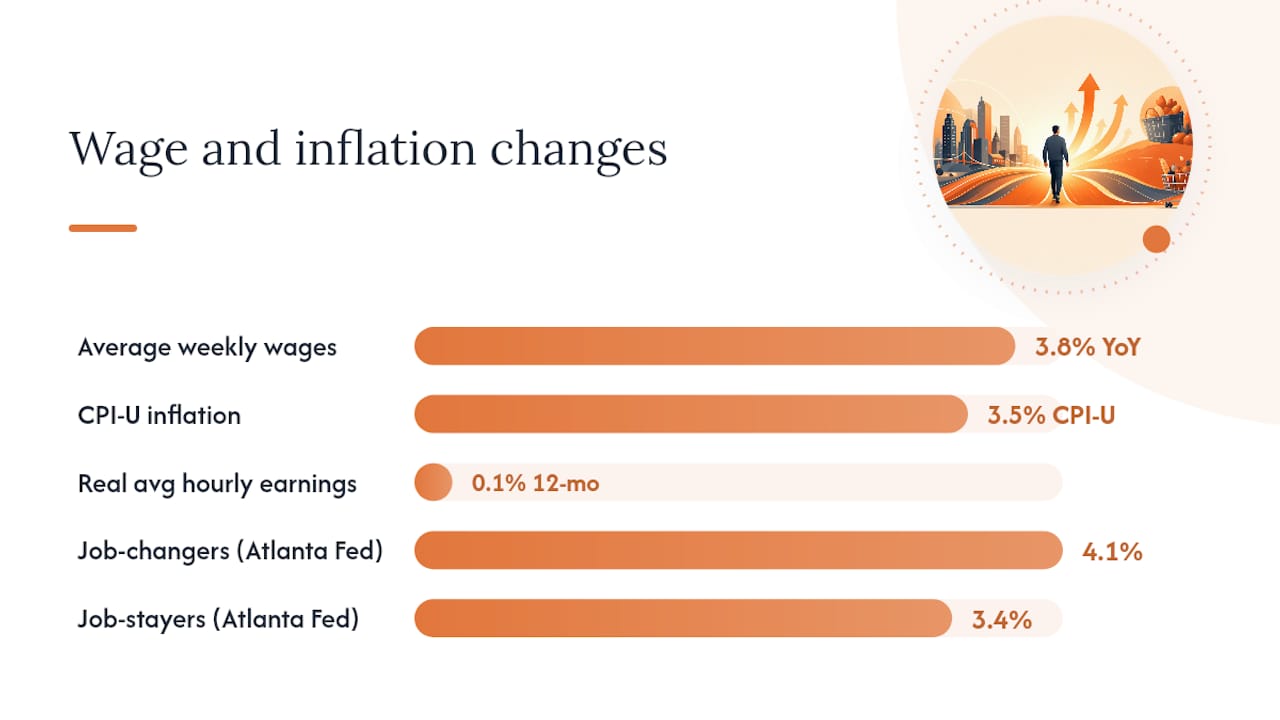
Table of Contents
- Are wages up right now? What the latest BLS and Atlanta Fed data show
- How are wage statistics measured, and why do different sources disagree?
- Nominal wages vs. real wages: what the difference means for your purchasing power
- Who actually saw wage gains, and who got left behind?
- Why did wages move, and what does it mean for workers and employers?
- What is the minimum wage situation in 2026?
- How to track wage and inflation data yourself going forward
- What the data actually tells you, and what it does not
- How Federal-rconstructionsolutions can help you factor wage changes into your bids
- Sources
- FAQ
Are wages up right now? What the latest BLS and Atlanta Fed data show
The headline data confirm a nominal increase in wages, but the series tell different stories depending on which measure you read.
Average hourly earnings for all employees rose year-over-year in nominal terms, while the BLS Real Earnings release shows real average hourly earnings gained just 0.1% over the same 12-month window. Month-over-month, real hourly earnings jumped 0.8% in June 2026, largely because CPI-U fell 0.4% that month — a temporary energy-driven swing, not a structural shift in pay.
The Atlanta Fed Wage Growth Tracker tells a more nuanced story. At 3.6% for June 2026 (3-month average), it tracks the same individuals over time rather than averaging across all payrolls. That methodology filters out composition effects — like the mix of high- and low-wage jobs entering or leaving the workforce — which is why its reading can diverge from BLS payroll averages.
| Series | Level/Index | MoM % Change | YoY % Change |
|---|---|---|---|
| Average hourly earnings (all employees) | Nominal | Not separately reported | 3.8% (nominal) |
| Average weekly earnings (all employees) | Nominal | Not separately reported | +3.8% |
| CPI-U | Index | -0.4% | +3.5% |
| Real average hourly earnings (all employees) | Inflation-adjusted | +0.8% | +0.1% |
| Real average weekly earnings (all employees) | Inflation-adjusted | Not separately reported | 0.1% |
| Atlanta Fed Wage Growth Tracker | Median matched-individual | Not reported | 3.6% (3-mo avg) |
Key takeaways from these columns:
- The 0.8% MoM real gain in June is encouraging but reflects a one-month CPI drop, not a sustained trend.
- The 0.1% YoY real gain confirms that most of the nominal wage increase in wages was absorbed by inflation over the full year.
- The Atlanta Fed’s 3.6% tracker sits above the real-earnings figure because it measures individual pay changes, not the payroll average.
Cross-checking these series against USAFacts confirms the 3.8% nominal weekly wage gain and 3.5% CPI figure, giving you a consistent picture across sources.
How are wage statistics measured, and why do different sources disagree?
Three distinct methodologies produce the wage figures you see in headlines, and each answers a slightly different question.
- BLS Current Employment Statistics (CES): A monthly payroll survey of roughly 119,000 businesses. It produces average hourly and weekly earnings for all employees and for production and nonsupervisory workers. Because it averages across everyone on payroll, it is sensitive to shifts in the job mix — if high-wage sectors add jobs faster, the average rises even if no individual got a raise.
- Current Population Survey (CPS): A household survey that captures individual-level earnings data, including part-time workers and the self-employed. Median earnings from the CPS reflect the midpoint worker’s experience rather than the payroll average.
- Atlanta Fed Wage Growth Tracker: Built from CPS microdata, it matches the same individuals across consecutive months and reports the median 12-month wage change. This eliminates composition bias — you are watching the same person’s pay change, not a shifting mix of workers. The tracker also shows that a notable share of workers report zero change in any given month, which means the median can mask wide dispersion at the tails.
Pro Tip: Use the Atlanta Fed Wage Growth Tracker when you want to understand what a typical worker actually experienced. Use BLS average hourly earnings when you need a payroll-level aggregate for budgeting or benchmarking labor costs across a sector.
For methodology details, the BLS CES technical notes and the Atlanta Fed tracker methodology page are the primary references.
Nominal wages vs. real wages: what the difference means for your purchasing power
Nominal wages are the dollar amount on your paycheck before any adjustment for price changes. Real wages are what those dollars actually buy after accounting for inflation.
Real average hourly earnings rose just 0.1% over the 12 months ending June 2026 — meaning the average worker’s paycheck bought almost exactly the same amount in June 2026 as it did a year earlier.
Here is a simple worked example. Suppose your hourly wage was $25.00 in June 2025. Your real gain is about $0.05 per hour — less than a dime.
Several personal factors can shift your individual outcome away from that average:
- Housing costs: Shelter inflation has been persistently above headline CPI. If rent or mortgage payments make up a large share of your budget, your personal inflation rate is likely higher than 3.5%, eroding real gains further.
- Commute and transportation: Energy prices drove the June 2026 CPI dip. If you drive frequently, you may have felt that relief — but it may not persist.
- Food at home vs. away from home: Grocery inflation and restaurant price increases have diverged, so your spending mix affects your real outcome.
The bottom line: nominal wage growth and real wage growth are not the same number, and for most workers in the past year, the gap between them was nearly the entire raise.
Who actually saw wage gains, and who got left behind?
Wage growth in 2026 has not been evenly distributed. The headline averages conceal real differences by industry, worker type, and geography.
Notable patterns by worker group and industry:
- Job-changers vs. job-stayers: The Atlanta Fed data show job-changers experienced higher wage growth than job-stayers, reflecting a premium for switching employers. Workers who negotiated new offers captured meaningfully more than those who relied on annual reviews.
- Production and nonsupervisory workers: This group, which covers roughly 80% of private-sector employees, tends to track closely with all-employee averages in nominal terms but often shows slightly lower real gains because their wages are more concentrated in sectors with higher price exposure.
- High-wage vs. low-wage industries: Sectors like professional and business services and financial activities have historically posted stronger nominal gains. Leisure and hospitality, which saw outsized increases during the post-pandemic labor crunch, has seen some moderation as labor supply normalized.
- State and metro variation: USAFacts tracks state-level wage data, and the spread between high-growth metros (parts of the South and Mountain West) and slower-growth regions remains wide. Checking your local market against national averages is worth the effort.
| Metric | All employees | Production & nonsupervisory |
|---|---|---|
| Real avg hourly earnings (YoY) | +0.1% | Closely tracks all-employee figure |
| Real avg weekly earnings (YoY) | +0.1% | Slightly lower due to hours variation |
| Nominal avg hourly earnings (YoY) | 3.8% | Similar nominal trajectory |
The BLS Real Earnings release publishes separate tables for both groups each month, making it straightforward to compare the two series directly.
For construction-sector employers specifically, nominal averages mask large within-trade variance. A blanket percentage increase applied across all roles can misalign with Davis-Bacon prevailing wage requirements and distort federal bid budgets. Trade-level market checks and certified payroll histories give a more accurate picture than the headline number alone.

Why did wages move, and what does it mean for workers and employers?
Three proximate drivers explain most of the recent wage movement.
Labor market tightness remains the primary engine. Unemployment has stayed relatively low, keeping employer competition for workers elevated. When it is harder to fill roles, employers raise offers — which is exactly what the job-changer premium reflects.
CPI composition shifts have created short-term noise in real earnings. Analysts note that real wage gains have been small or volatile for much of the past year, and a single favorable CPI print can reverse quickly.
Job mobility premium is the most actionable driver for individual workers. Workers who benchmark their current pay against market offers and negotiate accordingly capture a measurable advantage.
For employers, the implications cut both ways. Retention pressure is real: workers who know the job-changer premium exists are more likely to test the market. Relying solely on fixed cost-of-living adjustments to retain talent risks underpricing market raises. Active benchmarking against the Atlanta Fed tracker and sector-specific wage surveys is a more defensible approach than applying a uniform COLA.
The premium is what your best performers are being offered elsewhere.*
For construction firms managing federal bids, rising labor costs feed directly into bid win rates and unit cost estimates. Treating the headline wage increase as a flat escalator without checking trade-level data is one of the most common sources of underbidding on construction projects.
What is the minimum wage situation in 2026?
The federal minimum wage remains $7.25 per hour, unchanged since 2009. That floor applies to most private-sector employees covered by the Fair Labor Standards Act (FLSA), but it is largely irrelevant in practice because most states and many cities have set significantly higher minimums.
Here is how to verify the rate that applies to you or your workforce:
- Check your state’s Department of Labor website for the current minimum wage and any scheduled increases. Many states index their minimums to CPI, meaning automatic annual adjustments.
- Check your city or county — localities in states like California, New York, and Washington have set minimums well above their state floors.
- Confirm the effective date of any scheduled increase. Some jurisdictions phase in increases on January 1, others on July 1 or another date.
- For employers: when a local rate exceeds the federal or state floor, the higher rate applies. Posting requirements and recordkeeping obligations follow the governing jurisdiction.
- For federal contractors: Davis-Bacon prevailing wages and Service Contract Act rates are separate from minimum wage floors and are set by the Department of Labor on a contract-by-contract basis.
The Department of Labor’s minimum wage resources provide a state-by-state map and links to current rates. For federal contractors, the DOL Wage and Hour Division is the authoritative source for prevailing wage determinations.
How to track wage and inflation data yourself going forward
You do not need to wait for a news summary to know whether wages are keeping pace with inflation. The primary data sources publish on predictable schedules and are free to access.
- Subscribe to BLS news releases. Go to bls.gov and sign up for email alerts for the Real Earnings release (published monthly, usually around the 15th) and the Consumer Price Index release (published the same day or within a day). The Real Earnings release gives you nominal and real hourly and weekly earnings in one table. The CPI release gives you the inflation side.
- Bookmark the Atlanta Fed Wage Growth Tracker. The tracker page updates monthly and lets you filter by job-switcher status, age, education, industry, and wage quartile. Use it to answer “Are people like me getting raises?” rather than “What is the payroll average?”
- Check USAFacts for plain-language summaries. USAFacts aggregates BLS data and presents it in accessible charts with a clear verdict on whether wages are beating inflation. Good for a quick monthly check.
- Use FRED for historical context and custom charts. The Federal Reserve Economic Data platform at Fred hosts every major wage and price series going back decades. You can build a custom chart overlaying average hourly earnings and CPI-U in minutes, and FRED offers email alerts when a series updates.
- For long-run context, reference the SSA Average Wage Index. The Social Security Administration’s AWI tracks economy-wide average wages annually and is used to index Social Security benefits. It provides a useful long-run baseline against which to compare recent growth rates.
Which series answers which question:
- “Does my paycheck buy more?” → BLS Real Earnings release (real average hourly/weekly earnings, YoY)
- “Are workers getting raises?” → Atlanta Fed Wage Growth Tracker (median matched-individual)
- “How does inflation compare to my raise?” → CPI-U release vs. your nominal pay change
- “What is the long-run trend?” → FRED series for average hourly earnings + CPI, or SSA AWI
Pro Tip: Set a calendar reminder for the second or third week of each month — that is when BLS typically drops both the CPI and Real Earnings releases simultaneously. Reading them together takes about 10 minutes and gives you the full nominal-vs-real picture in one sitting.
For construction firms translating these numbers into bid line items, a labor cost calculator that computes fully burdened rates is a practical complement to the headline wage data.
What the data actually tells you, and what it does not
The numbers are clear enough: nominal wages are up, real wages are barely up, and the workers who gained the most are those who changed jobs. Some workers saw meaningful real increases; many saw none.
Treating it as a trend would be a mistake.
For construction-sector decision-makers, the practical implication is straightforward: do not apply a single national wage escalator to your bids. Trade-level variance, regional labor markets, and Davis-Bacon prevailing wage schedules all create meaningful differences from the headline figure. The Atlanta Fed tracker’s job-changer premium also signals that your best subcontractors and field supervisors are being recruited actively — retention budgets should reflect that reality, not just the CPI.
How Federal-rconstructionsolutions can help you factor wage changes into your bids

Rising labor costs affect every line item in a federal construction bid. Federal-rconstructionsolutions helps construction firms translate headline wage data into accurate, compliant bid submissions — from Davis-Bacon certified payroll to fully burdened labor rate calculations and RFP compliance. If your current estimating process uses last year’s wage figures, you are likely either leaving money on the table or pricing yourself out of awards.
Explore federal procurement support to see how the 5551 Pillar approach helps firms build bids that hold up under scrutiny. For firms managing private-sector margin pressure alongside federal work, private sector consulting services address the same labor cost challenges with a different compliance framework.
Sources
- Consumer Price Index News Release - 2026 M06 Results
- Wage Growth Tracker
- Are wages keeping up with inflation? | USAFacts
- Why inflation‑adjusted wage gains have evaporated
This article is general information, not a substitute for advice from a qualified financial advisor. Consult a qualified financial professional about your own circumstances before acting on anything here.
FAQ
Are wages up in the U.S. right now?
Yes, nominally.
Is the minimum wage going up in 2026?
The federal minimum wage remains $7.25 per hour, but many states and cities have set higher floors, some with automatic annual CPI adjustments. Check your state’s Department of Labor website or the DOL’s minimum wage page for the rate that applies to your location.
Are workers getting pay raises in 2026?
Most are, but the size depends heavily on whether they changed jobs.
What is the difference between nominal and real wage growth?
Nominal wage growth is the raw percentage increase in dollar pay; real wage growth subtracts inflation.
Where can I track wage data each month?
The BLS publishes the Real Earnings and CPI releases simultaneously each month (typically mid-month). The Atlanta Fed Wage Growth Tracker and USAFacts update shortly after, and FRED lets you chart any series with free email alerts.